Interim Baseline Radiological Investigation Report
November 14, 2012
Bear Lodge Project, for Rare Element Resources, Inc.
Rev.1
8
3.2.1 Project
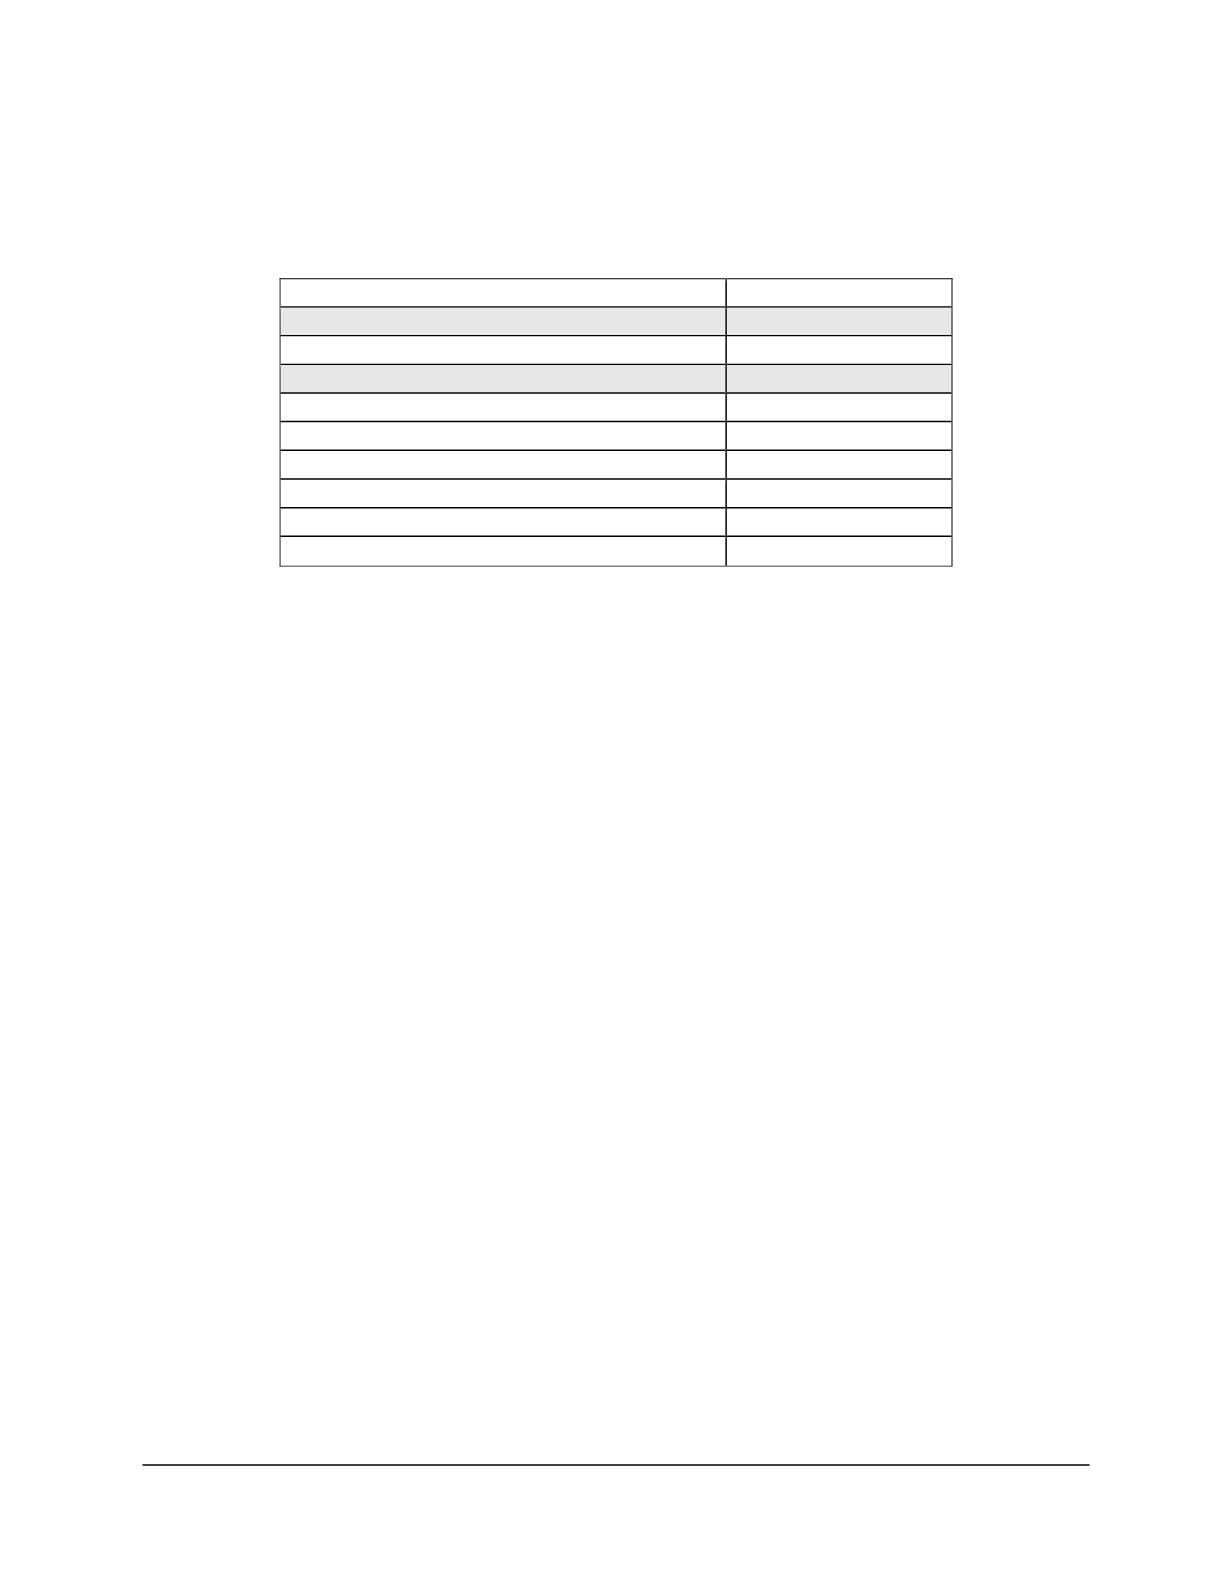
Table 3-1 provides a statistical summary of the gamma count rates recorded in the Project.
Table 3.1. Statistical Summary of Gamma Count Rate Data
Estimator/Endpoint
Gamma Data (cpm)
Mean (arithmetic)
31,152
Standard Deviation
21,000
Median
25,991
1
st
quartile
18,774
3
rd
quartile
36,970
IQR
18,196
Minimum
5,241
Maximum
394,897
Count
141,958
Notes:
cpm = counts per minute
IQR = interquartile range
Illustration 3.1 is a histogram of the frequency distribution of the gamma count rate data
collected within the Project. A theoretical lognormal distribution is plotted as the smooth line on
the illustration, for the purpose of reference. The distribution peaks at approximately 20,000 cpm
and tails off at approximately 50,000 cpm. The right tail represents gamma count rates that are
likely associated with near surface ore in the known mineralized portions of the Project. Visual
inspection of Illustration 3.1 shows that the data approximate a lognormal distribution even
though it fails lognormal statistical tests (see discussion below).
Illustration 3.2 is a probability distribution plot, with the theoretical distribution (blue line) set as
normal. Approximately 75 percent of the points align with the theoretical normal distribution;
however, distribution of gamma count rates cannot be described as normal because 1) there is a
discrepancy between the theoretical and actual distributions on the tails, which is reflected in the
difference in the median and mean; and 2) the data set does not pass the Anderson-Darling
Normality Test at a 95 percent level of significance.
Illustration 3.3 is a probability distribution plot, with the theoretical distribution set as lognormal.
The majority of points (approximately 95 percent) align with the theoretical lognormal
distribution; however, the distribution of gamma count rates cannot be described as lognormal
because there is a discrepancy between the theoretical and actual distributions on the tails.


