Interim Baseline Radiological Investigation Report
November 14, 2012
Bear Lodge Project, for Rare Element Resources, Inc.
Rev.1
10
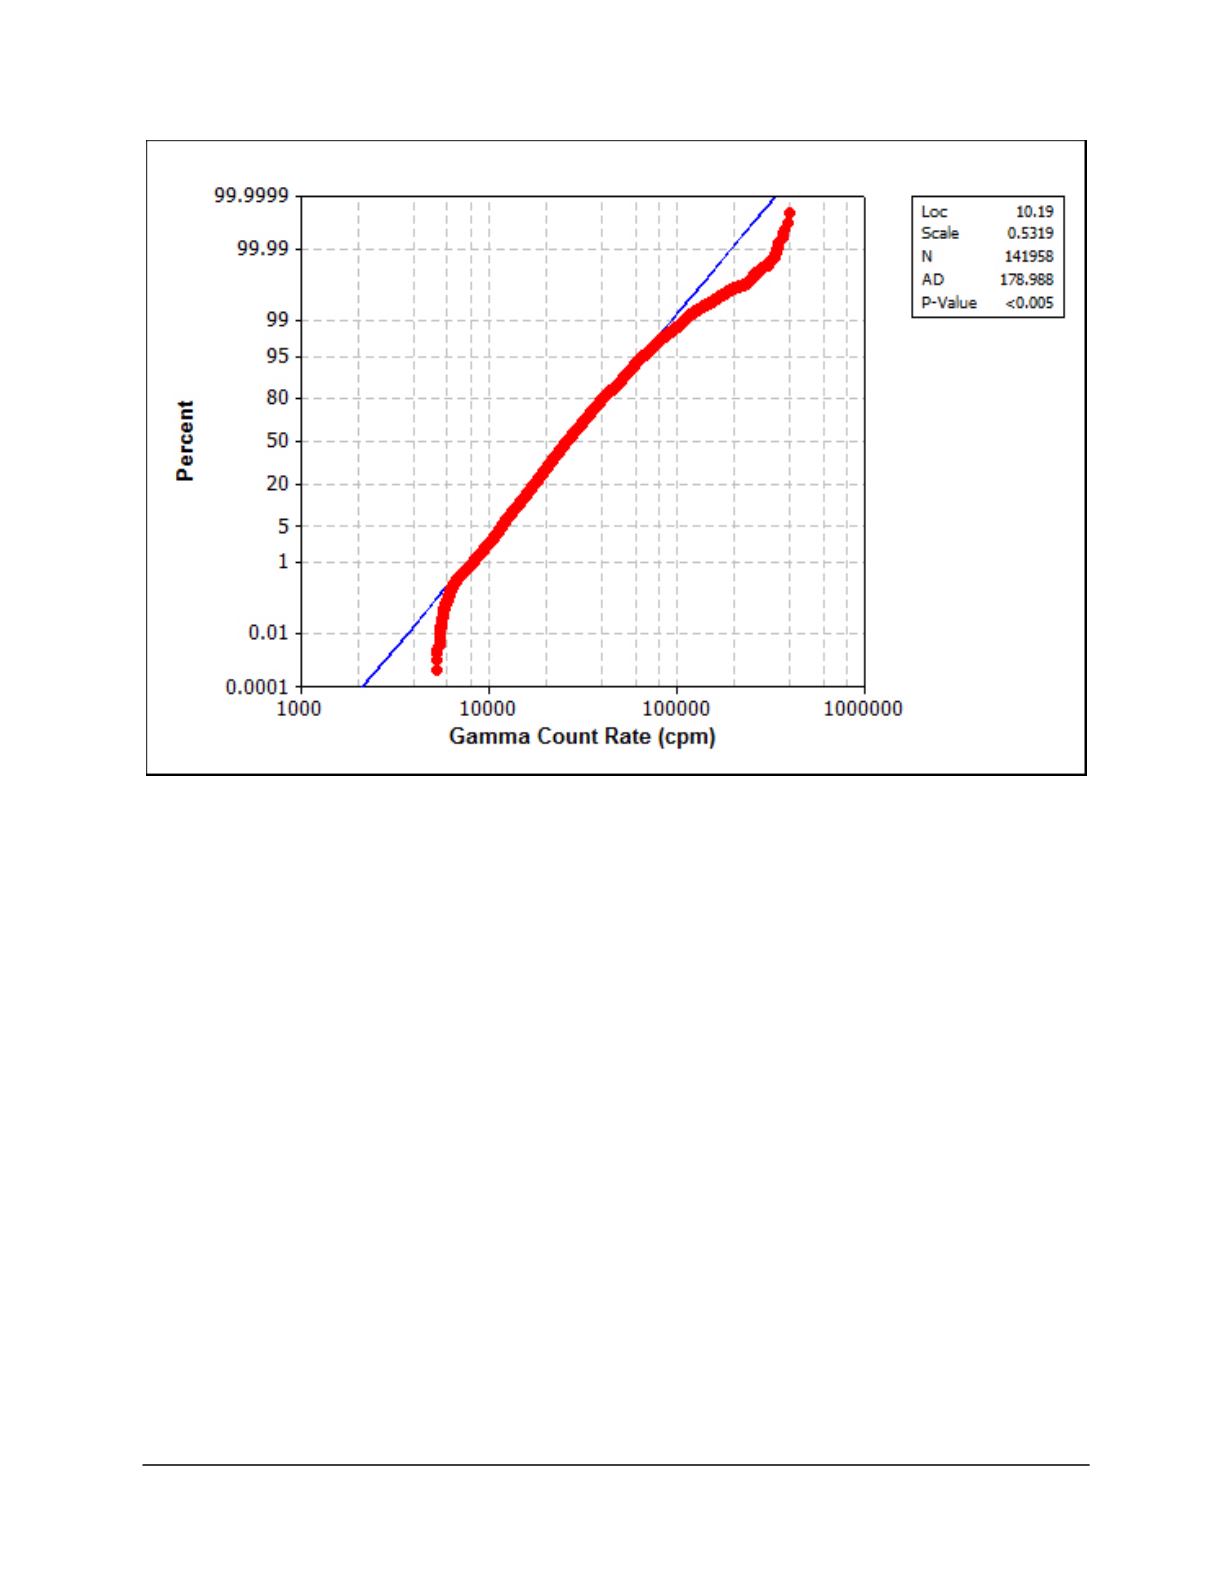
Illustration 3.3. Lognormal Probability Plot of Gamma Count Rates
Additional tests of the data sets (results not reported herein) indicated that none of them followed
a parametric distribution. Because no underlying distribution could be defined, data analysis and
summaries were performed using non-parametric statistical methods, which are less sensitive to
extreme observations typical of skewed data distributions and assume no underlying distribution.
The central tendency and variability of non-parametric data can be described by the median and
the interquartile range (IQR), respectively. The median of the population is 25,960 cpm. The
IQR encompasses the range between the 1
st
quartile (the first 25 percent of ascending, ranked
values) and 3
rd
quartile (the first 75 percent of ascending, ranked values). The IQR for the Project
is 18,196 cpm (=36,970 less 18,774 cpm).
3.2.2. Miller Creek Road
Table 3.2 provides a statistical summary of the gamma count rate data observed on the surveyed
portions of Miller Creek Road outside the Project.
The distribution of gamma count rates on Miller Creek Road was subject to the same probability
distribution tests as those described in Section 3.2.1. The overall distribution characteristics are
non-parametric (normal and lognormal probability distribution plots not shown). The median of
the gamma count rate data set is 9,818 cpm, with a corresponding IQR of 9,411 cpm (=16,540
less 7,129 cpm).


