Interim Baseline Radiological Investigation Report
November 14, 2012
Bear Lodge Project, for Rare Element Resources, Inc.
Rev.1
14
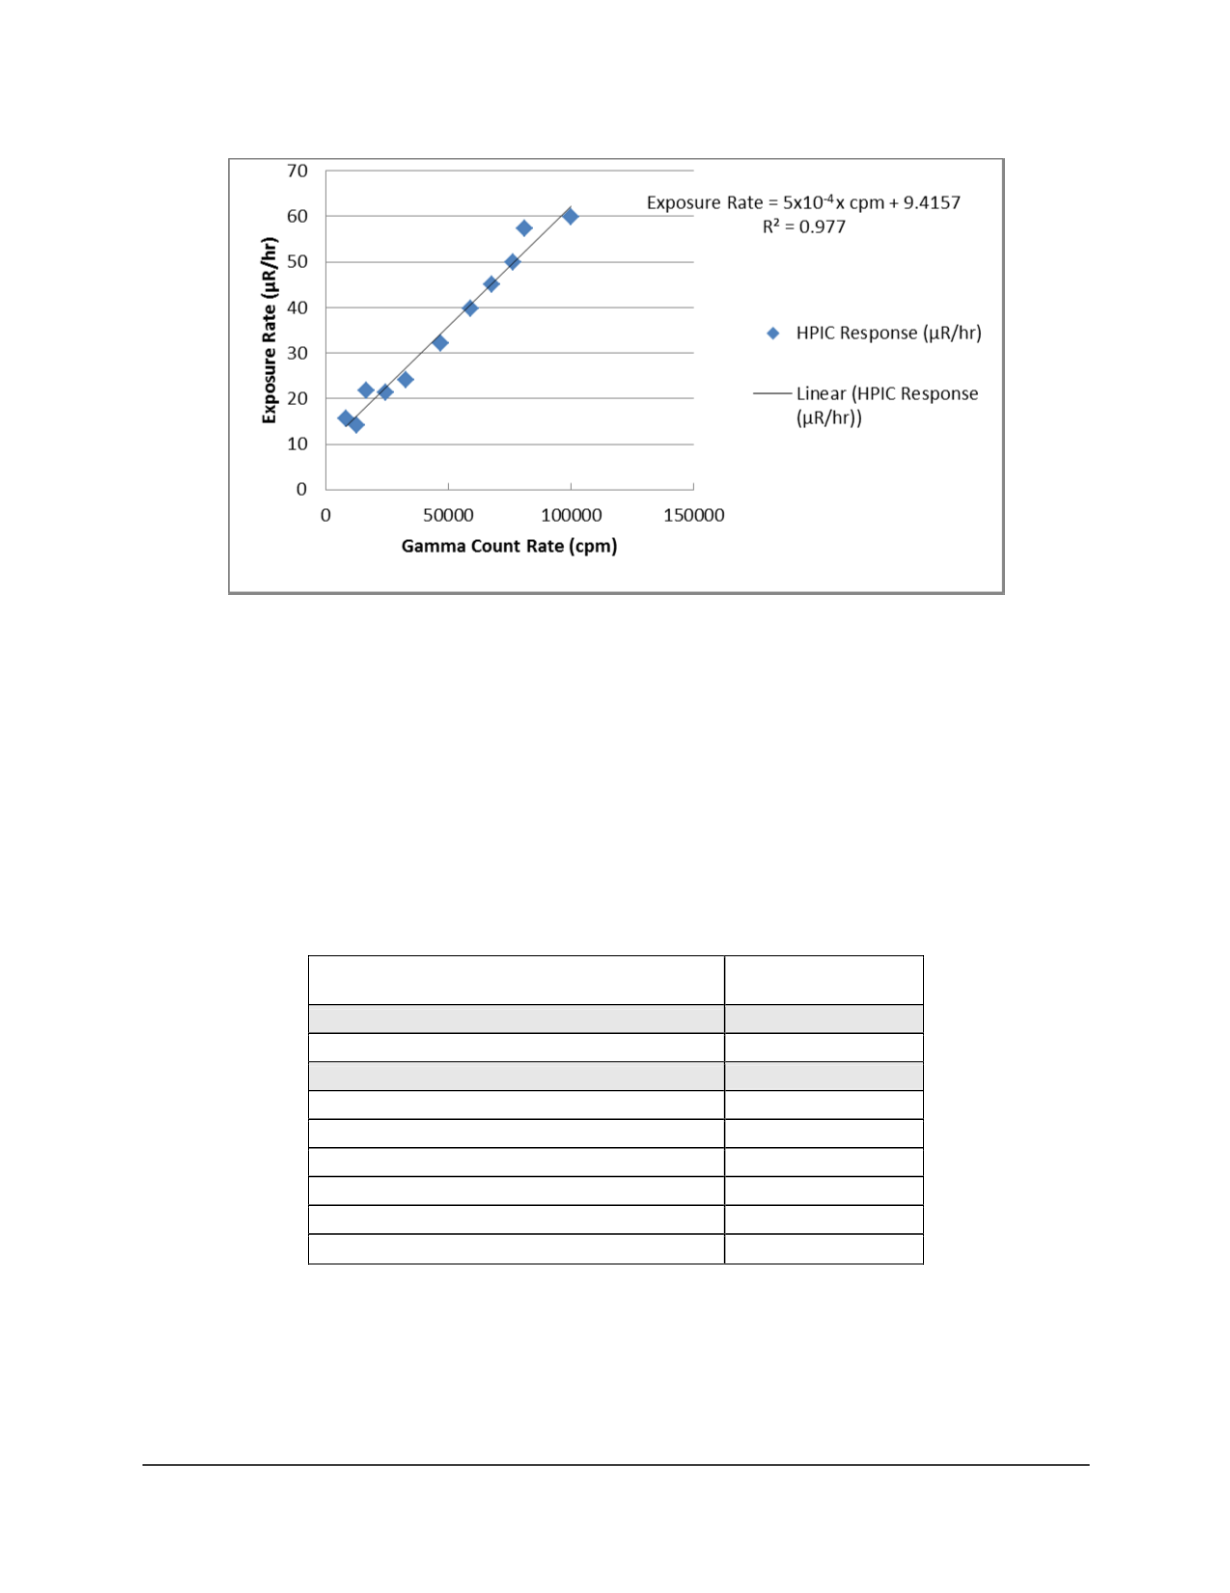
Figure 3.2. High Pressure Ion Chamber and Gamma Count Rate Measurement Linear
Regression Model
Table 3.4. Statistical Summary of Predicted Exposure Rates
Estimator/Endpoint
Exposure Rate
(µR/hr)
Mean (arithmetic)
25.0
Standard Deviation
10.5
Median
22.4
1
st
quartile
18.8
3
rd
quartile
27.9
IQR
9.1
Minimum
12.0
Maximum
206.9
Count
141,958
Notes:
cpm = counts per minute
IQR = interquartile range
µR/hr = micorRoentgens per hour


