Prefeasibility Access Road Design-Revised
38
Chloride Application on Unpaved Roads
0.3 gal/yd
2
applied every 90 days
1
1
0.3 gal/yd
2
treatment volume for chloride concentrations Best Practices for Dust Control on
Aggregate Roads, Minnesota Department of Transportation, Local Road Research Board,April
2009.
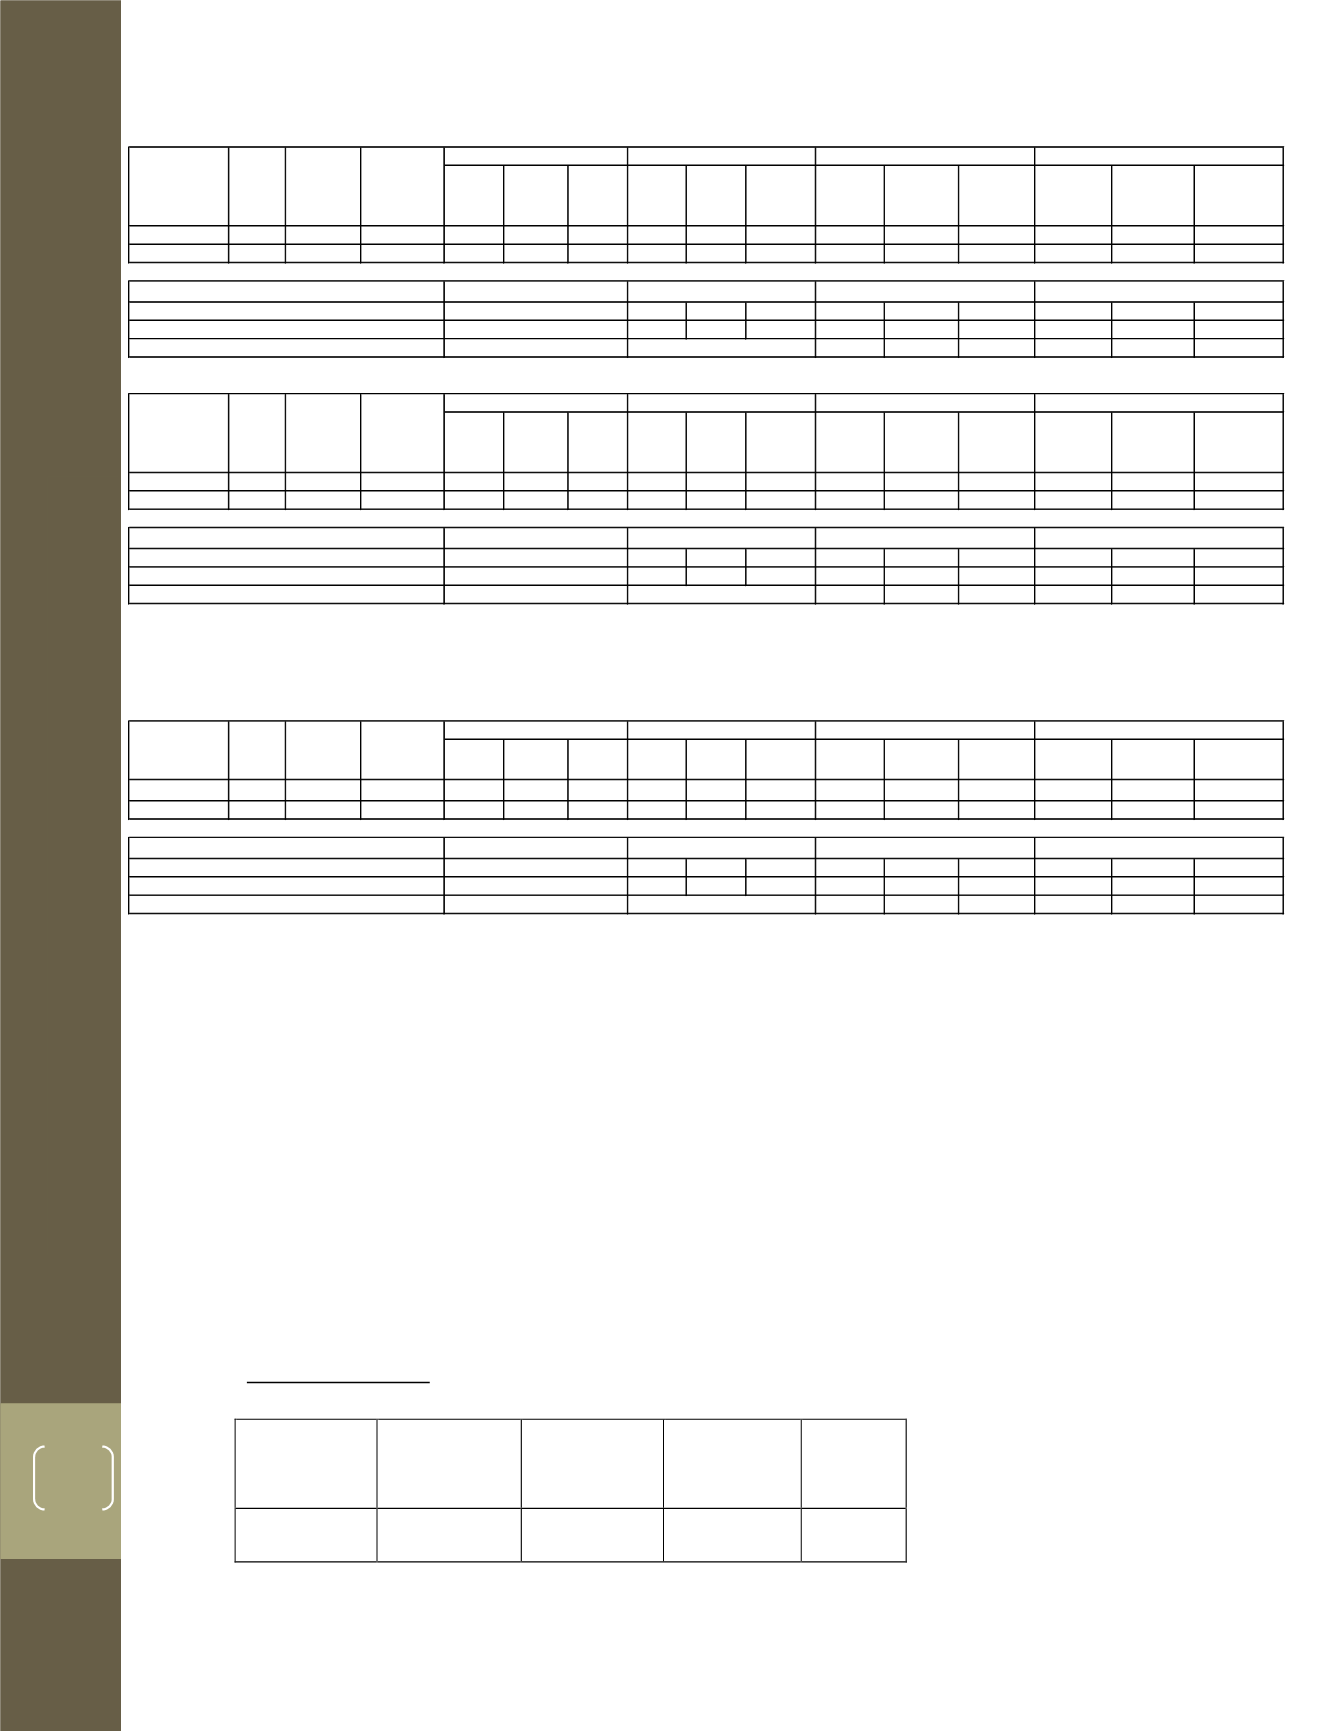
Miller Creek Route
Road Width
(ft)
Road
Length
(miles)
Road
Length (ft)
Area (ft
2
)
Area
(yd
2
)
24
10.15
53,592
1,286,208 428,736
INITIAL BUILD
3
PM
(lb/day)
PM
10
(lb/day)
PM
2.5
(lb/day)
PM
(lb/day)
PM
10
(lb/day)
PM
2.5
(lb/day)
PM
(lb/day)
PM
10
(lb/day)
PM
2.5
(lb/day)
PM
(lb/day)
PM
10
(lb/day)
PM
2.5
(lb/day)
Unpaved
14 11.08
155.12 834.49 214.42 21.44 417.24 107.21
10.72
208.62
53.61
5.36
83.45
21.44
2.14
Tons/day
0.42
0.11
0.01
0.21
0.05
0.01
0.10
0.03
0.00
0.04
0.01
0.00
0.21
0.05
0.01
0.31
0.08
0.01
0.38
0.10
0.01
Gallons/Ton (Compared to baseline)
84,212 327,734 3,277,344
112,283 436,979 4,369,793
233,923
910,373
9,103,735
Incremental Gallons/Ton (from previous control)
168,424 655,469 6,554,689
842,122 3,277,344 32,773,445
FINAL AGGREGATE COVERAGE
PM
(lb/day)
PM
10
(lb/day)
PM
2.5
(lb/day)
PM
(lb/day)
PM
10
(lb/day)
PM
2.5
(lb/day)
PM
(lb/day)
PM
10
(lb/day)
PM
2.5
(lb/day)
PM
(lb/day)
PM
10
(lb/day)
PM
2.5
(lb/day)
Unpaved
14 18.85
263.83 1419.32 364.70 36.47 709.66 182.35
18.23
354.83
91.17
9.12
141.93
36.47
3.65
Tons/day
0.71
0.18
0.02
0.35
0.09
0.01
0.18
0.05
0.00
0.07
0.02
0.00
0.35
0.09
0.01
0.53
0.14
0.01
0.64
0.16
0.02
Gallons/Ton (Compared to baseline)
49,512 192,691 1,926,908
66,017 256,921 2,569,211
137,534
535,252
5,352,522
Incremental Gallons/Ton (from previous control)
99,025 385,382 3,853,816
495,124 1,926,908 19,269,081
2
Control for 50% and 90% are provided for comparison of water requirements to 75%
3
Initial build of the Warran Peak Route is proposed as 5.54miles of aggregate; the balance will be existing asphalt. As the asphalt deteriorates, RER will covert those portions to aggregate.
PM
(lb/day)
PM
10
(lb/day)
PM
2.5
(lb/day)
PM
(lb/day)
PM
10
(lb/day)
PM
2.5
(lb/day)
PM
(lb/day)
PM
10
(lb/day)
PM
2.5
(lb/day)
PM
(lb/day)
PM
10
(lb/day)
PM
2.5
(lb/day)
Paved
4
14 7.77
108.71 46.87
9.37
2.30 30.93
6.19
1.52
17.57
3.51
0.86
5.34
1.07
0.26
Tons/day
0.02
0.00
0.00
0.02
0.00
0.00
0.01
0.00
0.00
0.01
0.00
0.00
0.01
0.00
0.00
0.01
0.00
0.00
0.02
0.00
0.00
Gallons/Ton (Compared to baseline)
0
0
0 2,257,637 11,288,185 45,988,904 1,515,275 7,576,373 30,866,707
Incremental Gallons/Ton (from previous control)
7,178,128 35,890,641 146,221,130
0
0
0
1
34% control based on vacuum sweeping, see Table 3
2
49.6% control based on water flushing, see Table 3
3
73.9% control based on water flushing with sweeping, see Table 3
4
Pavement will be replaced with aggregate over the life of the route; therefore, this route will be entirely unpaved.
Control v Baseline (additional tons controlled)
NA
NA
NA
NA
Gallons to Achieve Control Efficiency (gal/d)
1,2
NA
29,881
59,762
149,405
Parameter
Number
of
Vehicles
(per day)
Distance
Traveled
(mi/d)
Total
Distance
(per day)
Uncontrolled (Baseline)
NA
Controlled @73.9%
3
Controlled @34%
1
Controlled @49.6%
2
26,240
Controlled @50%
Controlled @75%
Controlled @90%
Controlled @90%
Gallons to Achieve Control Efficiency (gal/d)
1,2
NA
17,569
35,137
87,843
Parameter
Number
of
Vehicles
(per day)
Distance
Traveled
(mi/d)
Total
Distance
(per day)
Uncontrolled (Baseline)
Controlled @50%
Gallons to Achieve Control Efficiency (gal/d)
1,2
NA
0
26,240
Controlled @75%
1
Represents gallons per day required to achieve the given control effiency of PM
10
according to Control of Fugitive Dust Sources, EPA-450/3-88-908, Eq. 3-2 (1988) as shown on Table 1, Water Application
Intensity for Dust Suppression.
Control v Baseline (additional tons controlled)
NA
Parameter
Number
of
Vehicles
(per day)
Distance
Traveled
(mi/d)
Total
Distance
(per day)
Uncontrolled (Baseline)
NA
NA
Control v Baseline (additional tons controlled)
NA
NA
NA
NA


