Prefeasibility Access Road Design-Revised
34
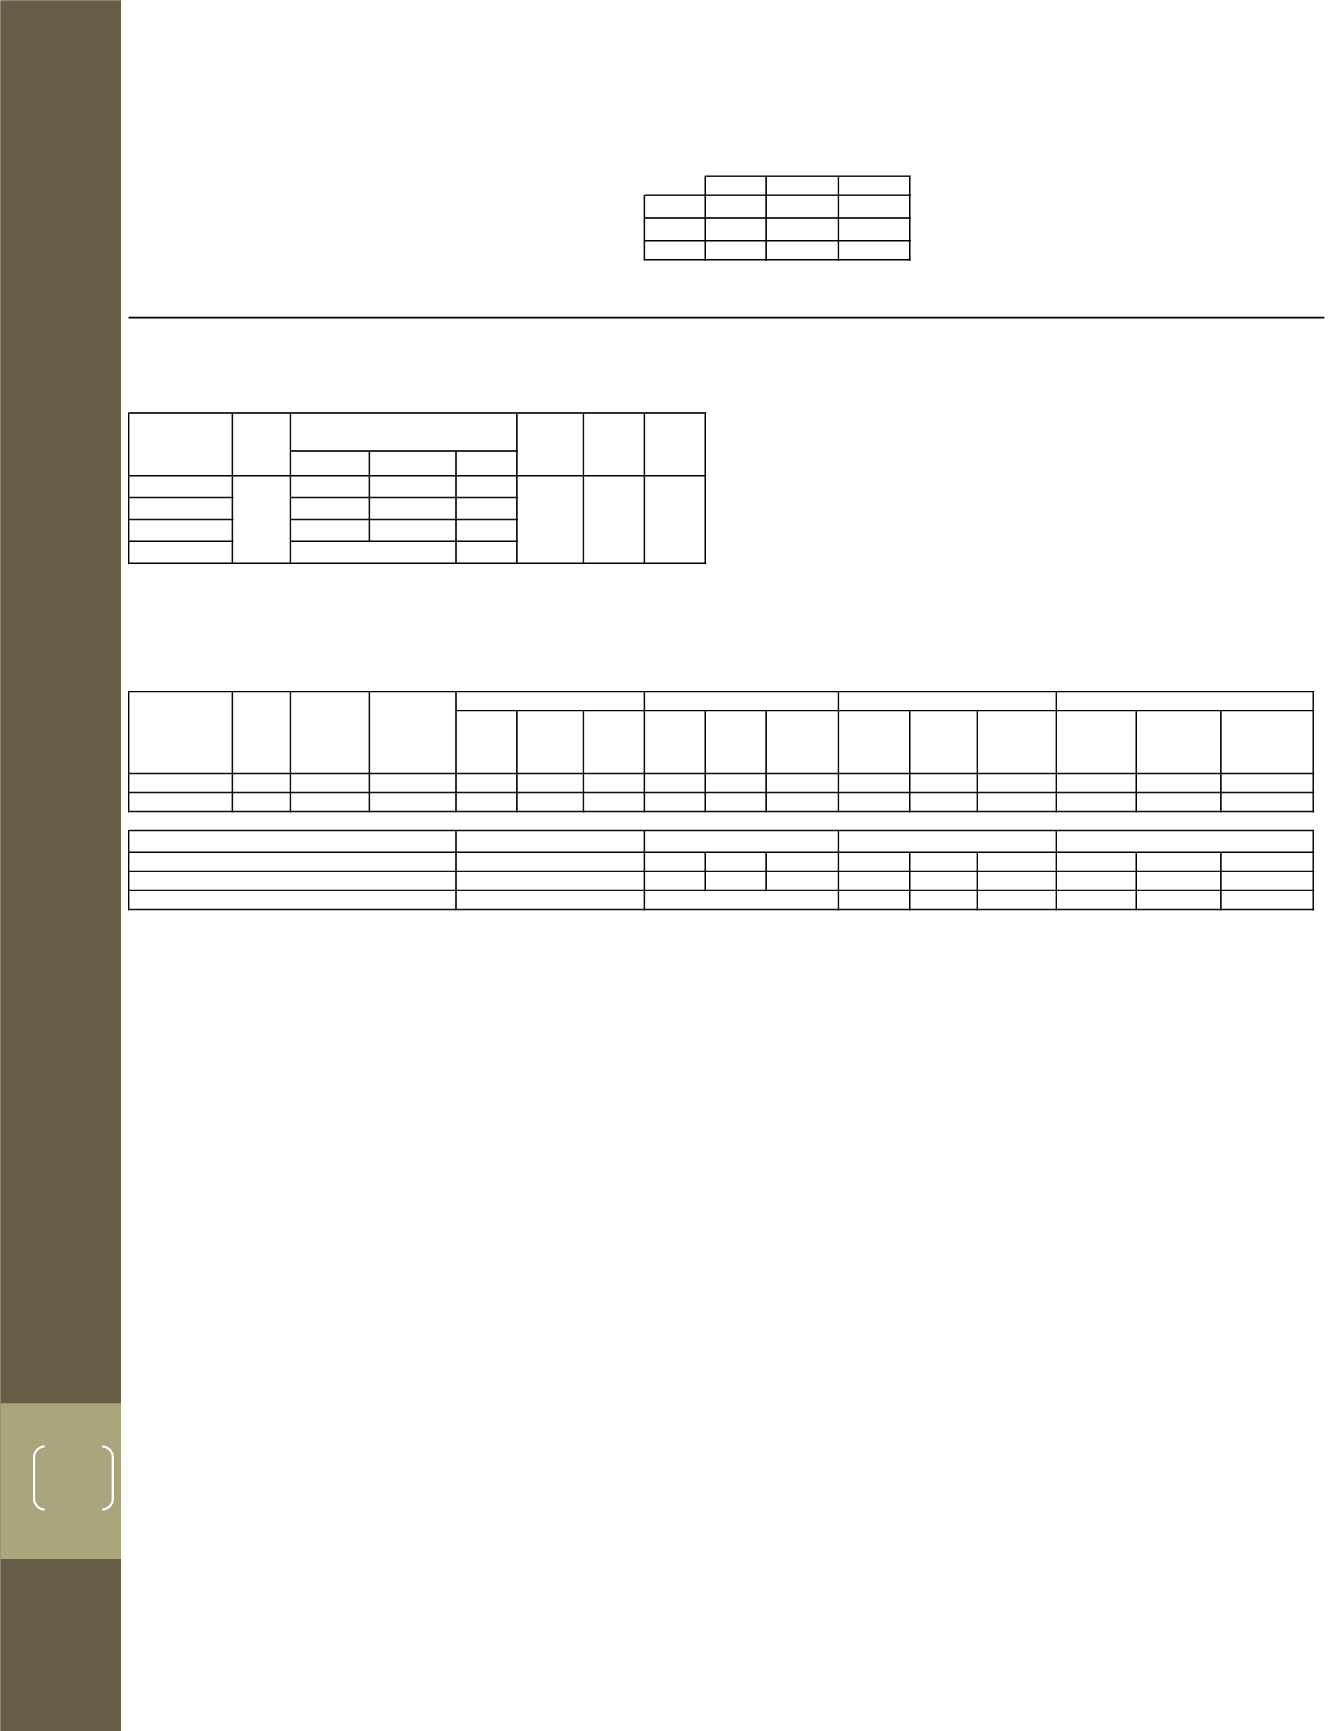
MILLER CREEK ESTIMATION OF UNPAVED ROAD EMISSIONS
k
a
b
PM
2.5
0.15
0.9
0.45
PM
10
1.5
0.9
0.45
PM
4.9
0.7
0.45
P = number of days in a year with at least 0.01 inch of preciptiation (assumed at 90 days per AP-42, Figure 13.2.2-1)
Shift Bus
3 per day
OTR Truck/pups
8 per day
Supply Truck
3 per day
Full
Empty
Avg
Shift Bus
2
9.75
7.25
8.5
OTR Truck/pups
3
58.5
20 39.25
Supply Truck
4
16.5
9.5
13
Fleet Average
5
27
1
EPA-450/3-88-908, Table 3-1 Typical Silt Content Values of Surface Material on Industrial and Rural Unpaved Roads (September 1988)
2
Shift bus weight taken from
for 25 passenger bus; full weight assumes 200 lb per passenger
3
Haul truck specifications provided by RER
4
Supply truck weight based on Ryder 26 ft box truck with a 33,000 gvw, up to 14,000 lb of load capacity
5
AP-42, Section 13.2.2 requires that the lb/vmt emission factor be prepared on a weighted fleet average; it should not be developed vehicle by vehicle
PM
(lb/day)
PM
10
(lb/day)
PM
2.5
(lb/day)
PM
(lb/day)
PM
10
(lb/day)
PM
2.5
(lb/day)
PM
(lb/day)
PM
10
(lb/day)
PM
2.5
(lb/day)
PM
(lb/day)
PM
10
(lb/day)
PM
2.5
(lb/day)
Total Vehicles
14 20
280 1506.31 387.05 38.70 753.15 193.52
19.35
376.58
96.76
19.35
150.63
38.70
3.87
Tons/day
0.75
0.19
0.02
0.38
0.10
0.01
0.19
0.05
0.00
0.08
0.02
0.00
0.38
0.10
0.01
0.56
0.15
0.01
0.68
0.17
0.02
85,475 332,650 3,326,505
113,967 443,534 4,435,340
237,432
924,029
9,240,291
170,951 665,301 6,653,009
854,754 3,326,505 33,265,047
2
Control for 50% and 90% are provided for comparison of water requirements to 75%
3
Annual weighted daily average based on 245 days per year at summer water conditions and 120 days at annual conditions
32,188
64,376
160,940
NA
0.14
VMT = Vehicle Mile Traveled
PM
2.5
(lb/vmt)
Controlled @75%
Controlled @90%
s = surface material silt content (%)
a = constant based on PMfraction, unitless
W = mean vehicle weight (tons)
b = constant based on PMfraction, unitless
Vehicle Weight (tons)
PM
10
(lb/vmt)
NA
NA
Incremental Gallons/Ton (from previous control)
Distance
Traveled
(mi/d)
Number
of
Vehicles
(per day)
Number of
Vehicles per
Type
Control v Baseline (additional tons controlled)
Gallons to Achieve Control Efficiency (gal/d)
1,2,3
Uncontrolled (Baseline)
NA
NA
1
Represents gallons per day required to achieve the given control effiency of PM10 according to Control of Fugitive Dust Sources, EPA-450/3-88-908, Eq. 3-2 (1988) as shown on Table 1, Water
Application Intensity for Dust Suppression.
E = emission factor (lb/VMT)
k = constant based PMfraction (lb/VMT)
Controlled @50%
Vehicle Type
Silt
Content
1
(%)
PM
(lb/vmt)
Total
Distance
(per day)
Constants
5
5.38
1.38
Gallons/Ton (Compared to baseline)


