Prefeasibility Access Road Design-Revised
36
1
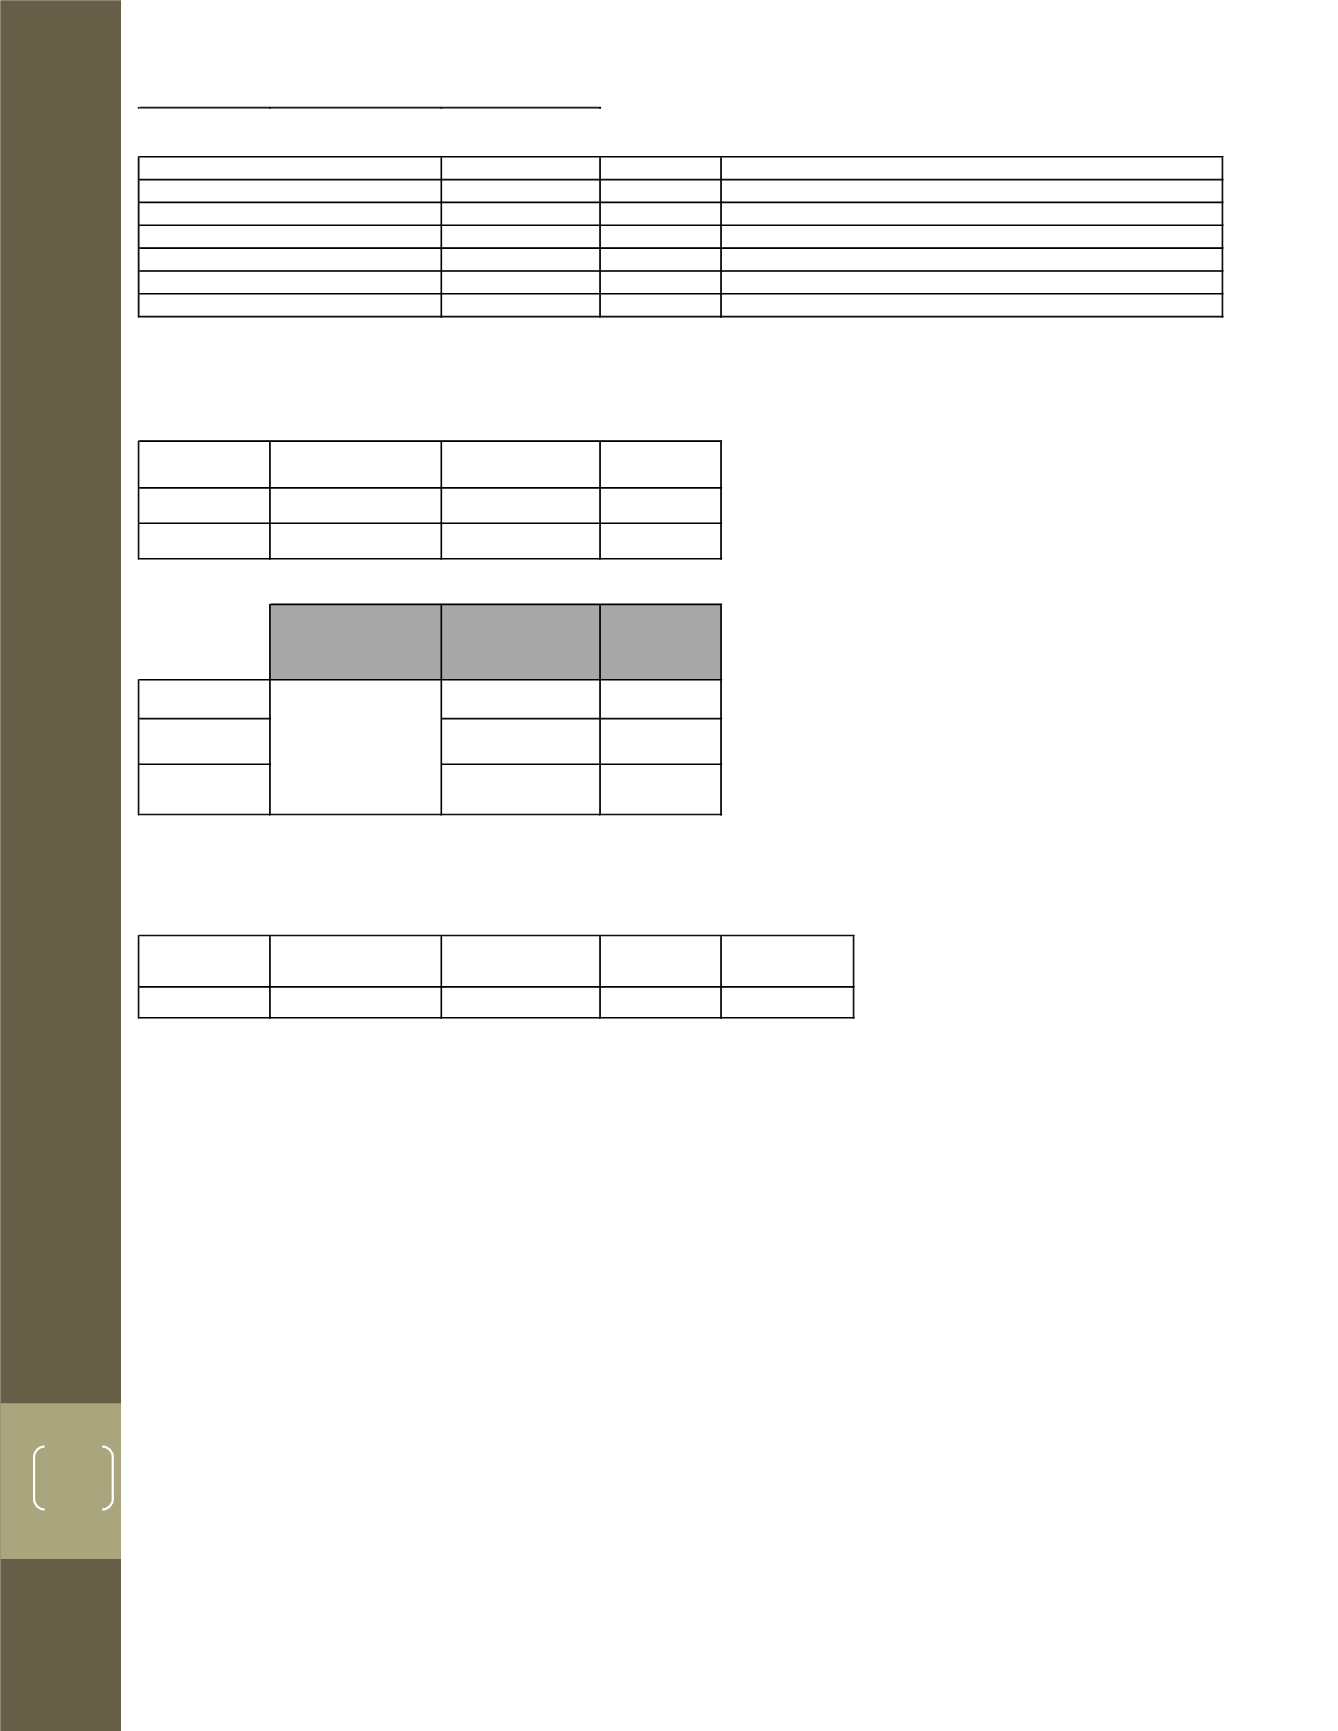
Hourly daytime evaporation rate [p] developed using guidance in EPA-450-3-88-908 as follows
Value
Unit
60 inches per year
1524 mm per year
0.0049 NA
0.0065 NA
7.47 mm/hr
9.91 mm/hr
3
Conversion from L/m
2
-h to gal/ft
2
-h assumes 1 gallon = 3.785 L, and 1m
2
= 10.76 ft
2
4
Application Volume per day considers the application intensity applied over the entire area of the road for 12 hours per day. The area of the road determined as
5
Summer conditions assumed May - December (245 days); Winter conditions assumed January - April (120 days)
Road Width (ft)
Road Length
(Miles)
Road Length
(ft)
Area (ft
2
)
24
5.54
29,251
702,024 Initial Build
24
9.42
49,751
1,194,024 Final Aggregate Coverage
WARREN PEAK ROUTE - PAVED
Vehicle Passes
(between sweeping)
[V]
1
Control Efficiency (%)
[C]
Application
Volume
(gallons/day)
3
Water Flushing
49.6
26,240
Water Flushing
with Sweeping
73.9
26,240
Vacuum
Sweeping
2
34
0
2
Control efficiency given in Control of Fugitive Dust Sources, EPA-450/3-88-908, Table 2-4 (1988).
3
Based on water applied at 0.48 gal/yd
2
, given in Control of Fugitive Dust Sources, EPA-450/3-88-908, Table 2-4 (1988). Assumed road flushing once every 3 days.
Road Width (ft)
Road Length (miles)
Road Length (ft)
Area (ft
2
)
Area (yd
2
)
24
3.88
20,500
492,000
164,000
Type A Pan Evaporation, hourly
Summer Average
EPA-450/3-88-908, Eq. 3-2 supplemental info
Type A Pan Evaporation, hourly
Annual Average
Summer to Hourly Conversion Factor
EPA-450/3-88-908, Eq. 3-2 supplemental info
1
Daily vehicle passes based on traffic information provided by RER, See Table 2. This assumes that traffic is evenly distributed over 24 hours. Only RER traffic
considered; inclusion of other traffic may alter the amount of water necessary for control.
1
Daily vehicle passes based on traffic information provided by RER, See Table 2. This assumes that traffic is evenly distributed over 24 hours. Only RER traffic
considered; inclusion of other traffic may alter the amount of water necessary for control.
Parameter
Notes
Type A Pan Evaporation, annual rate
AP-42, Figure 13.2.2-3, Mean Annual Class A Pan Evaporation Rate
Type A Pan Evaporation, annual rate
25.4mm per inch
84
Annual to Hourly Conversion Factor


