Interim Baseline Radiological Investigation Report in
Support of the Upton Rare Earth Processing Plant
November 15, 2012
26
6.0
RADON FLUX MEASUREMENTS
This section summarizes the results of baseline radon-222 (Rn-222) flux measurements
conducted in accordance with Section 2.3.5 of the SAP. Field data and analytical results
supporting the Rn-222 flux data are contained in Appendix C.
In accordance with the SAP, radon flux rates were measured at five locations, which coincided
with sample locations as shown on Figure 4.1. Five, plus two duplicate canisters were deployed
and retrieved on June 13 and 14, 2012, respectively. These canisters were analyzed using EPA
Test Method 115,
Monitoring for Radon-222 Emissions
.
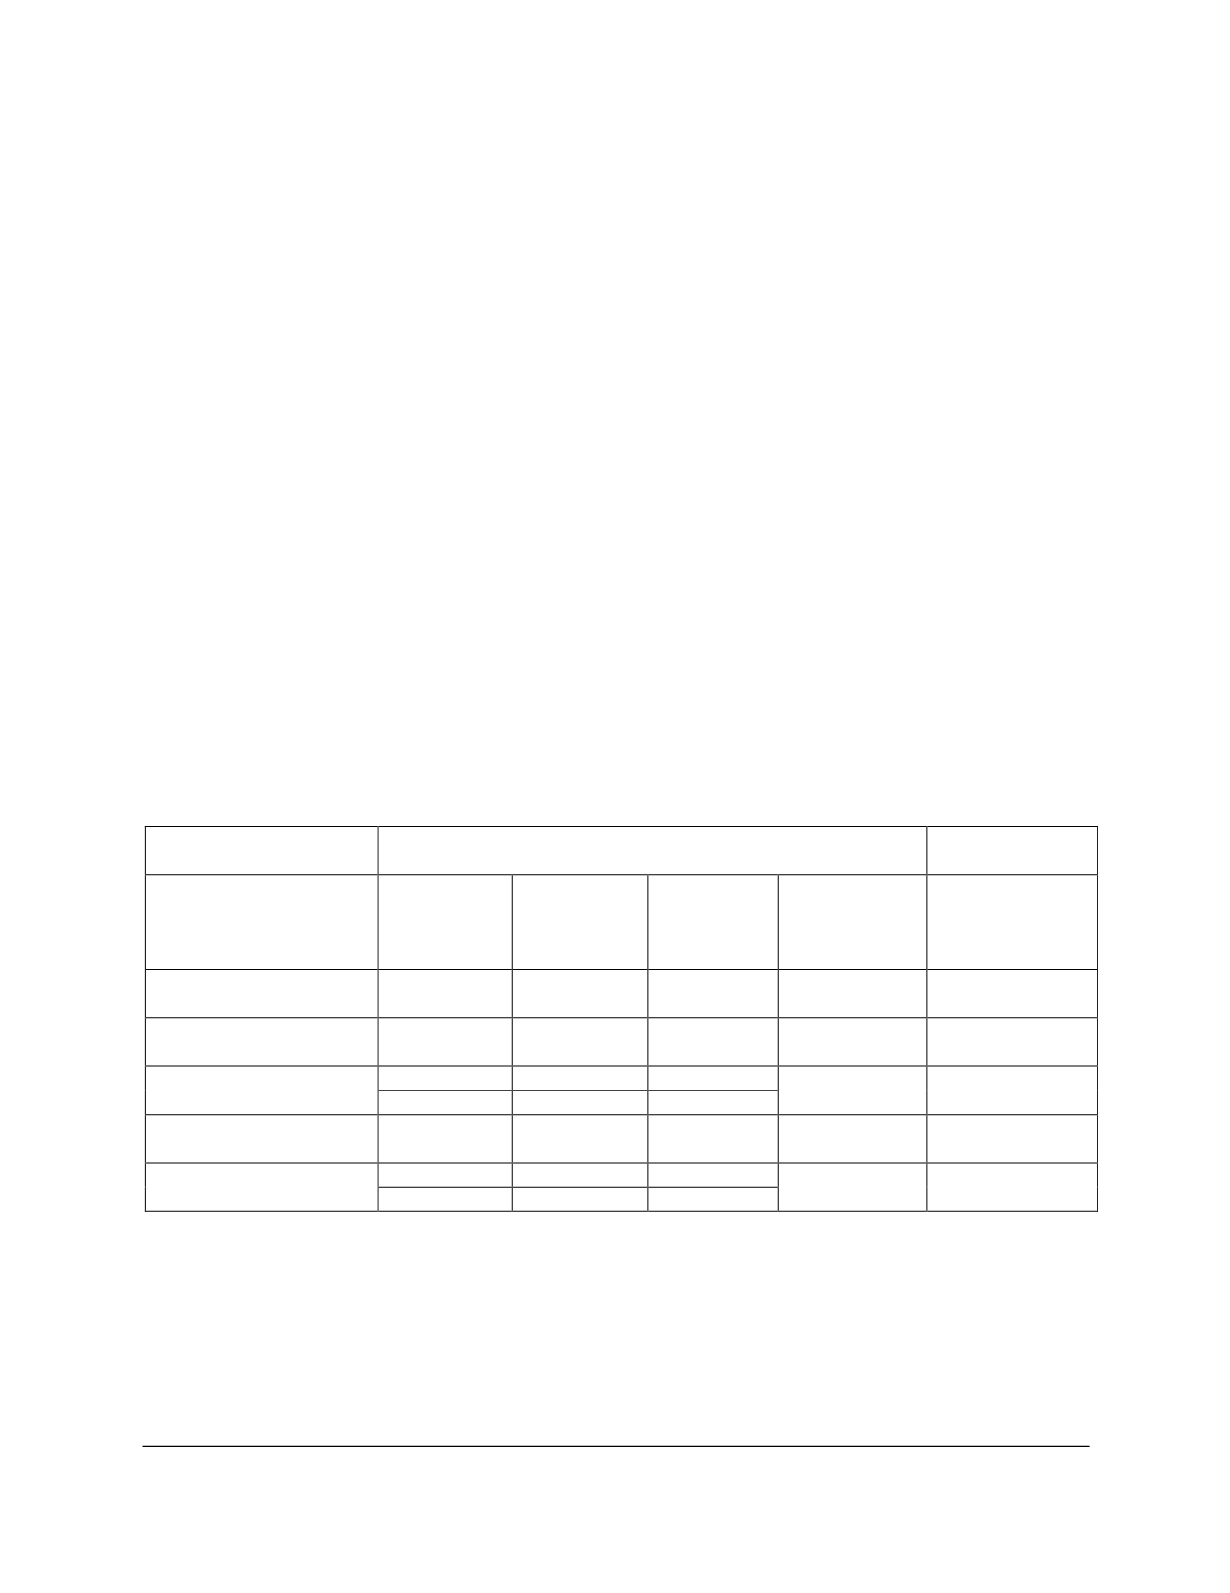
Table 4.1 notes the five radon flux locations, all of which coincided with those for soil samples.
Table 6.1 documents the results, and lists Ra-226 concentrations in corresponding soil samples.
Radon flux rates ranged between 0.20 and 1.22 picocuries per meter squared second (pCi m
-2
s
-1
).
These values are below the National Emissions Standards for Hazardous Air Pollutants
(NESHAPS) requirement of 20 pCi m
-2
s
-1
prescribed in 10
Code of Federal Regulations
40,
Appendix A, Criterion 6. Although the latter requirement applies to tailings and thus is not
directly germane to this characterization, it is useful as a context to demonstrate the relative
magnitude of baseline radon flux levels measured in the areas where construction and mining
activities are anticipated to occur. There are to be no trends in the radon fluxes, as compared to
radium-226 concentrations in associated soil samples.
Table 6.1. Radon Flux Results
Radon-222 (pCi m
-2
s
-1
)
Sample Location
Flux
Flux Error
(±1σ)
LLD
Average Flux
Ra-226
Concentration
(pCi g
-1
)
SS-01-SS-061412
1.22
0.05
0.1
1.22
1.4
SS-02-SS-061412
0.20
0.04
0.1
0.20
1.6
SS-07-SS-061412
a
0.48
0.04
0.1
0.42
1.8
0.35
0.05
0.1
SS-13-SS-061412
b
0.93
0.05
0.1
0.93
1.4
SS-16-SS-061412
a
0.57
0.04
0.1
0.66
2.3
0.74
0.05
0.1
Notes:
a
Duplicate canister deployed
b
Duplicate sample collected. Radium-226 result is the average of the sample and duplicate results.
LLD = lower limit of detection
Ra-226 = Radium-226
pCi g
-1
= picocuries per gram
Rn-222 = Radon-222
pCi m
-2
-s = picocuries per meter squared second
σ = standard deviation


