Interim Baseline Radiological Investigation Report in
Support of the Upton Rare Earth Processing Plant
November 15, 2012
24
5.0
DATA QUALITY ASSESSMENT
This section briefly summarizes the results of the quality control (QC) samples collected for the
baseline soil sampling program. As indicated in Table 2.1, 25 percent of the soil samples were
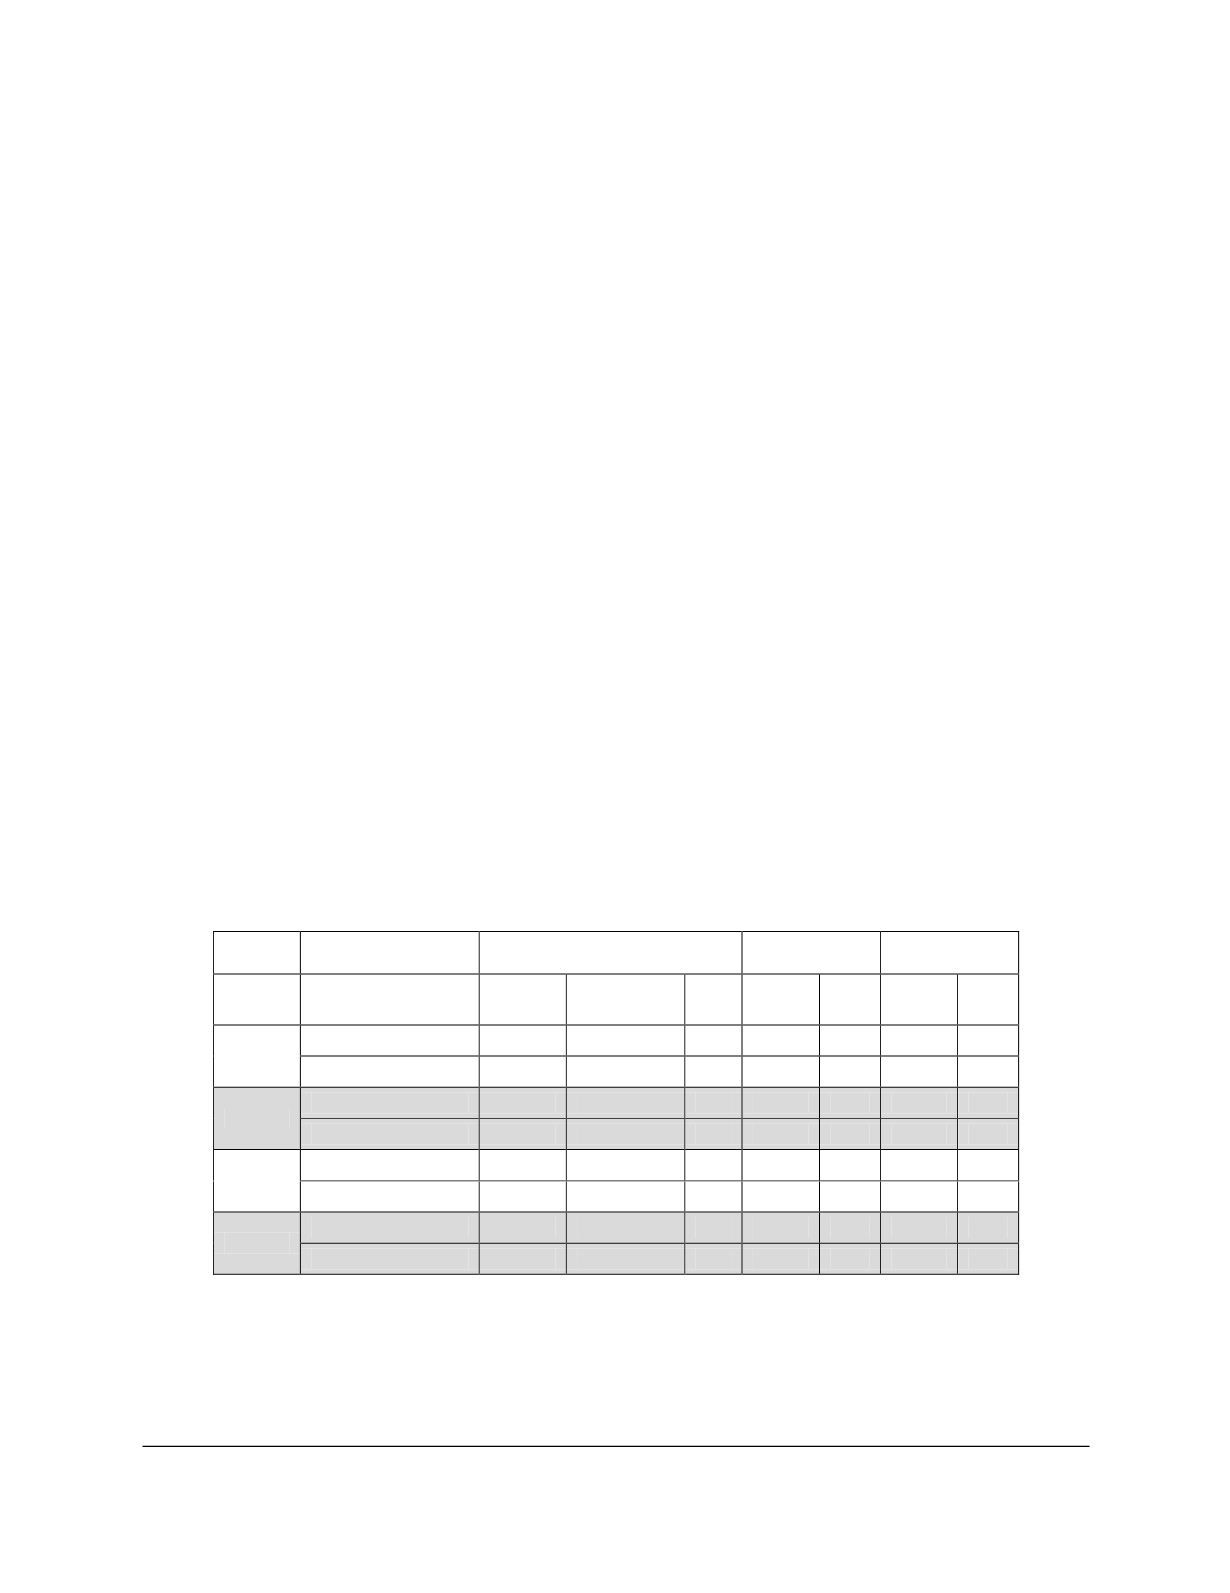
duplicated for QC purposes. The results of this QC effort are documented in Table 5.1, which
lists the analytical results for each duplicate pair along with corresponding errors and reporting
limits (RLs). Table 5.2 documents associated comparisons, presenting the corresponding
Replicate Error Ratio (RER) or Relative Percent Difference (RPD), in the cases of Th-nat and U-
nat) for each QC pair.
QC trends in the radium-228 concentrations cannot be discussed, because apparently erroneous
non-detections are reported by the laboratory in 12 of 20 samples.
Examination of the results provided in Table 5.1 indicates that, in general, there is close
agreement in the analytical results reported for each duplicate pair collected for all parameters.
Because duplicate results are generally comparable for the majority of QC samples collected and
the other parameters for this pair of soil samples were within acceptable ranges, no request to re-
analyze the samples were made.
Table 5.2 presents the corresponding RER and, in the cases of Th-nat and U-nat, RPDs
calculated for each duplicate pair. The calculation of RER and RPDs is a standard technique used
to evaluate QC samples. Typically, an RER of < 2 and an RPD of <20 percent is used as a
guideline in many data quality objective evaluations. This data set reveals no cases where either
the RER or RPD was greater than 2 and 20, respectively. Thus, the laboratory performance on
blind duplicates is satisfactory.
Table 5.1. QA-QC Comparison Results
Radium-226
(pCi g
-1
)
U-nat
(mg kg
-1
)
Th-nat
(mg kg
-1
)
Sample
Pair
Sample Location
Result
Error ± 1σ
RL Result MDL Result MDL
1
SS-07-SS-061412
1.8
0.5
0.3
2
0.01
13
0.02
SS-18-SS-081311
1.8
0.5
0.3
3
0.01
14
0.02
2
SS-10-SS-061412
1.8
0.6
0.3
3
0.01
15
0.02
SS-19-SS-081311
1.5
0.5
0.3
3
0.01
14
0.02
3
SS-12-SS-081311
1.0
0.3
0.3
2
0.01
11
0.02
SS-17-SS-081311
1.4
0.5
0.3
2
0.01
11
0.02
4
SS-13-SS-081311
1.0
0.3
0.3
1
0.01
6
0.02
SS-20-SS-061412
1.6
0.5
0.3
2
0.01
7
0.02
Notes:
MDL = method detection limit
mg kg
-1
= milligrams per kilogram
pCi g
-1
= picocuries per gram
σ = standard deviation


