Interim Baseline Radiological Investigation Report in
Support of the Upton Rare Earth Processing Plant
November 15, 2012
13
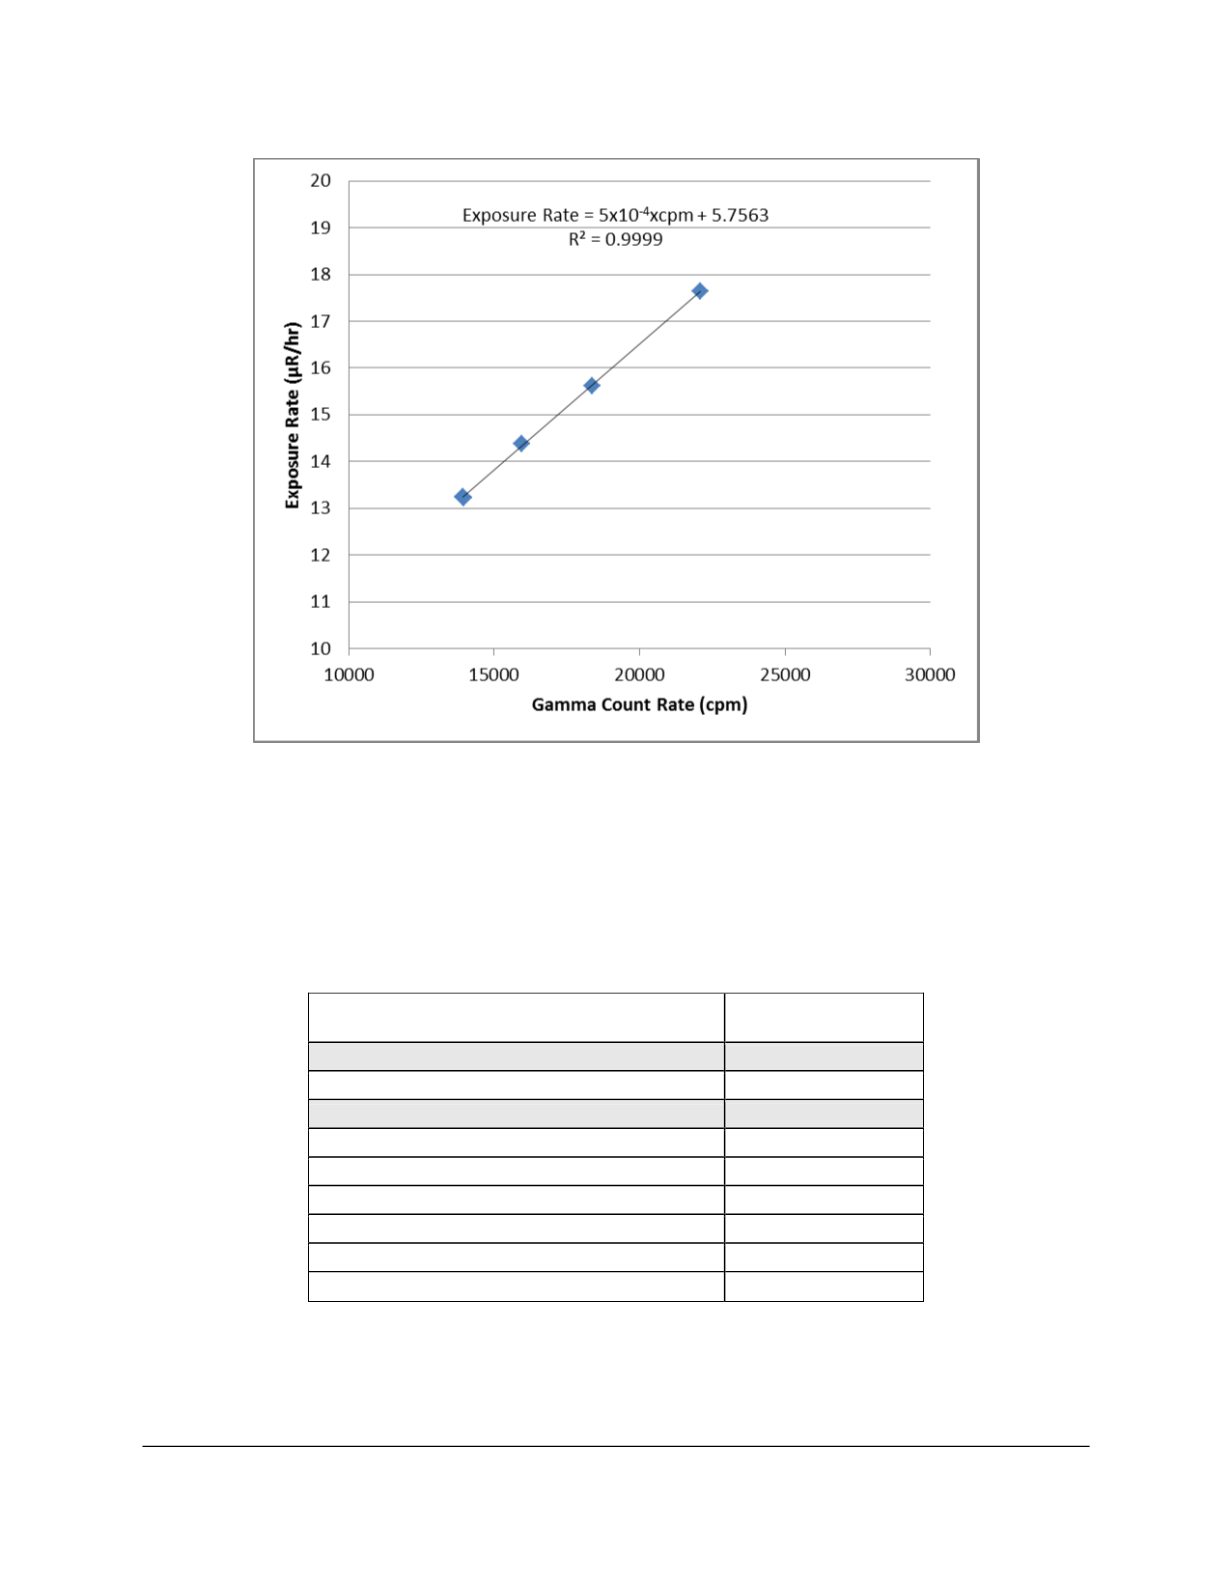
Figure 3.2. High Pressure Ion Chamber and Gamma Count Rate Measurement Linear
Regression Model
Table 3.3. Statistical Summary of Predicted Exposure Rates
Estimator/Endpoint
Exposure Rate
(µR hr
-1
)
Mean (arithmetic)
13.7
Standard Deviation
0.9
Median
13.8
1
st
quartile
13.1
3
rd
quartile
14.3
IQR
1.2
Minimum
10.1
Maximum
19.3
Count
38,023
Notes:
cpm = counts per minute
IQR = interquartile range
µR hr
-1
= microRoentgens per hour


