Interim Baseline Radiological Investigation Report in
Support of the Upton Rare Earth Processing Plant
November 15, 2012
10
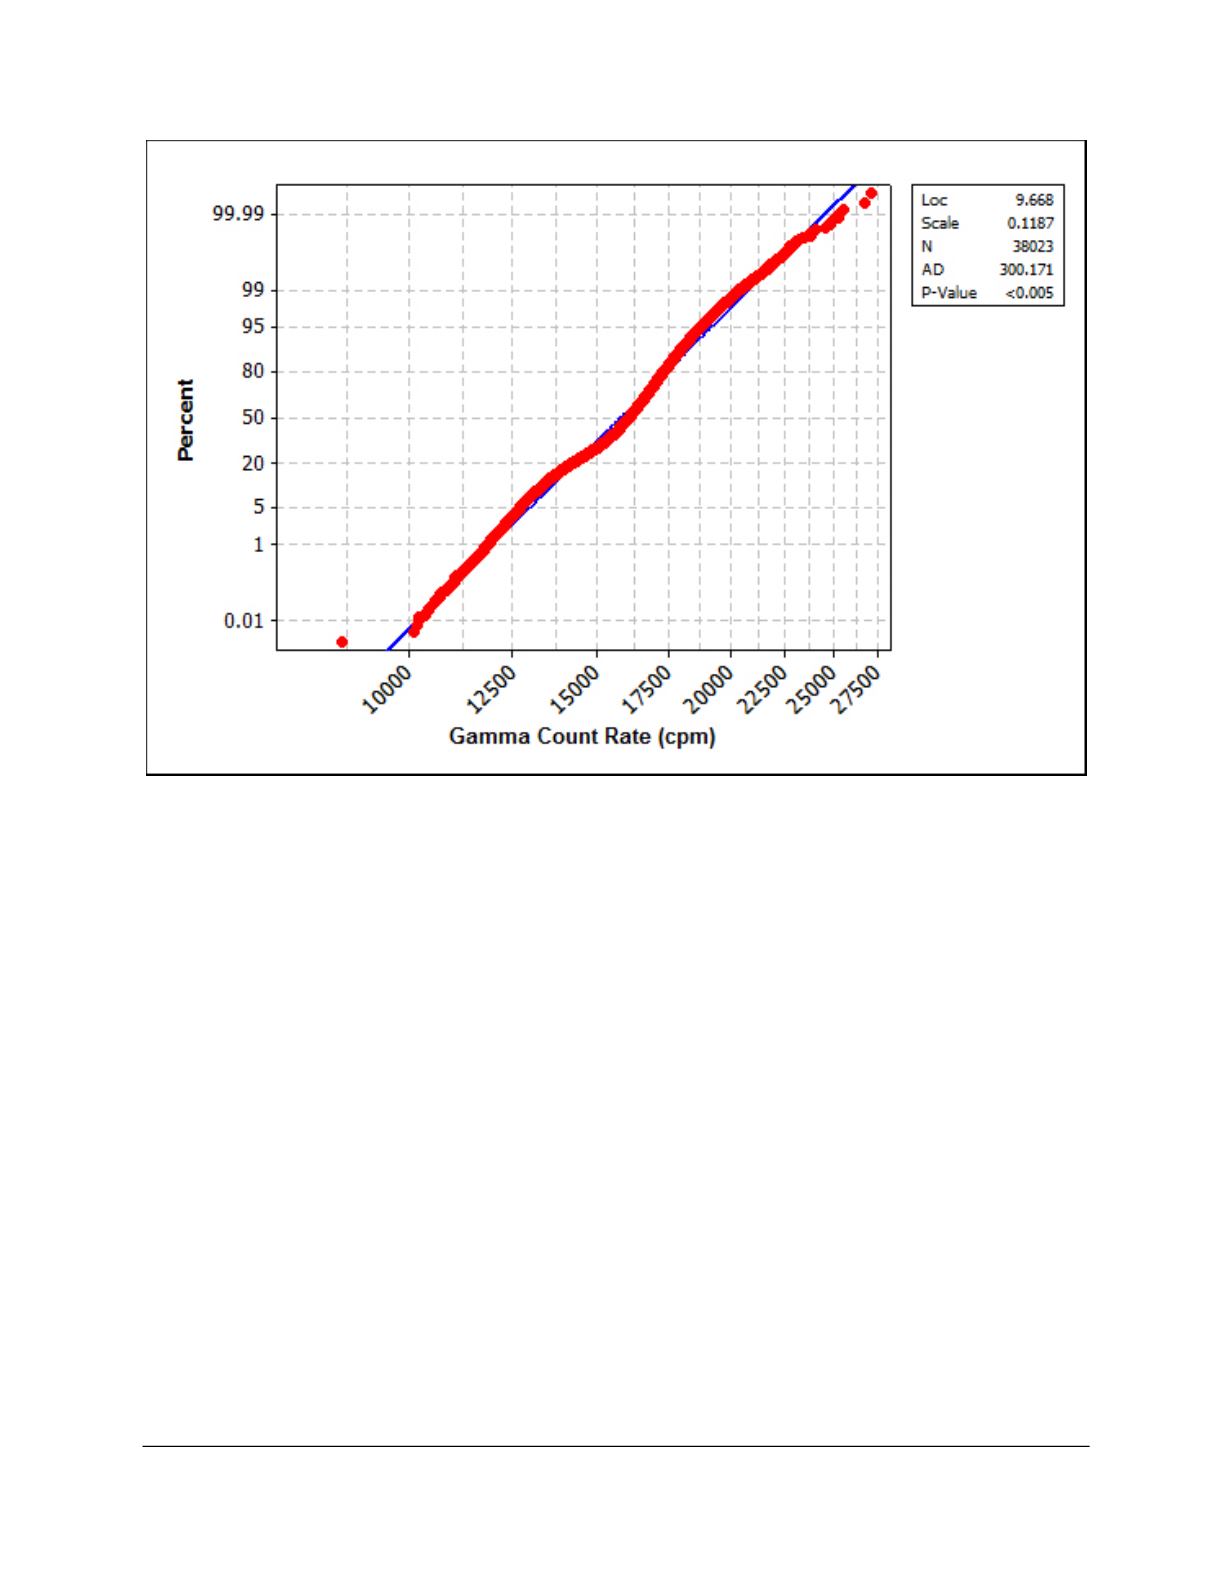
Illustration 3.3. Lognormal Probability Plot of Gamma Count Rates
Additional tests of the data sets (results not reported herein) indicated that none of them followed
a parametric distribution. Because no underlying distribution could be defined, data analysis and
summaries were performed using non-parametric statistical methods, which are less sensitive to
extreme observations typical of skewed data distributions and assume no underlying distribution.
The central tendency and variability of non-parametric data can be described by the median and
the interquartile range (IQR), respectively. The median of the population is 16,091 cpm. The
IQR encompasses the range between the 1
st
quartile (the first 25 percent of ascending, ranked
values) and 3
rd
quartile (the first 75 percent of ascending, ranked values). The IQR is 2,405 cpm
(or 17,092 less 14,687 cpm).
3.2.1 Area-Specific Gamma Count Rates
A visual observation of the gamma count rates indicates that the data can be apportioned to two
areas: 1) those west of a north-south trending ridge and 2) the remainder. The distributions of
these data sets —each tested for normality and lognormality—are nonparametric. A Mann-
Whitney test indicates that the distributions are statistically different, at a confidence level of 95
percent.
Gamma count rates west of the ridge average 13,583 cpm, with a median and standard deviation
of 13,521 and 1,035 cpm, respectively. Those in the remainder of the Upton Project average
16,604 cpm, with a median and standard deviation of 16,529 and 1,430 cpm, respectively.


